Getting Started with rekuiper
This document describes how to install rekuiper and create an edge stream processing pipeline. It uses the REST API, the kuiper CLI, and the web management dashboard.
1. Overview of the Scenario
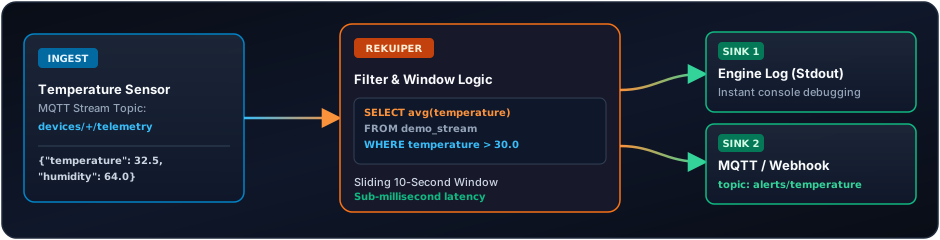
An industrial sensor transmits temperature and humidity readings each second. The pipeline completes these tasks:
- Ingest telemetry events continuously.
- Filter anomalous temperature events (for example,
temperature > 30.0°C). - Calculate a moving average across a sliding 10-second window.
- Transmit alerts to a local log or target MQTT broker without buffering or latency spikes.
2. Prerequisites and rekuiper Startup
Start rekuiper in Docker:
docker run -d \
  --name rekuiper \
  -p 9081:9081 \
  -p 20498:20498 \
  -p 20499:20499 \
  ankurkrp/rekuiper:0.506-beta
Verify that the server operates:
curl http://localhost:9081/ping
# Response: pong
3. Method A: Management with the REST API
The HTTP REST API is the primary interface for automation scripts, CI/CD pipelines, and visual management tools.
Step 1: Create a Stream
Define a stream named sensor_stream. The stream receives data from the sensor/data MQTT topic or HTTP push:
curl -X POST http://localhost:9081/streams \
  -H "Content-Type: application/json" \
  -d '{
    "sql": "CREATE STREAM sensor_stream (temperature float, humidity bigint) WITH (DATASOURCE=\"sensor/data\", FORMAT=\"JSON\")"
  }'
Step 2: Create a Streaming Rule
Deploy a rule that calculates the average temperature across a 10-second tumbling window:
curl -X POST http://localhost:9081/rules \
  -H "Content-Type: application/json" \
  -d '{
    "id": "temp_monitor_rule",
    "sql": "SELECT avg(temperature) as avg_temp, max(temperature) as max_temp FROM sensor_stream GROUP BY TumblingWindow(ss, 10) HAVING avg_temp > 30.0",
    "actions": [
      {
        "log": {}
      }
    ]
  }'
Step 3: Inject Test Data
Send sample events to the stream:
curl -X POST http://localhost:9081/streams/sensor_stream/data \
  -H "Content-Type: application/json" \
  -d '{"temperature": 32.5, "humidity": 65}'

curl -X POST http://localhost:9081/streams/sensor_stream/data \
  -H "Content-Type: application/json" \
  -d '{"temperature": 35.0, "humidity": 68}'
Step 4: Monitor Rule Execution
Check the runtime execution metrics:
curl http://localhost:9081/rules/temp_monitor_rule/status4. Method B: Management with the kuiper CLI
rekuiper is compatible with the kuiper command-line tool.
Execute CLI commands directly inside the running container:
# Open an interactive shell inside the container
docker exec -it rekuiper /bin/sh

# List existing streams
bin/kuiper show streams

# Create a stream
bin/kuiper create stream cli_demo '(temperature float, humidity bigint) WITH (DATASOURCE="cli_demo", FORMAT="JSON")'

# Submit an ad-hoc query
bin/kuiper query
Submit a query inside the interactive prompt:
kuiper > SELECT * FROM cli_demo WHERE temperature > 30.0;
Query was submit successfully.
5. Method C: Management with the Web Console (eKuiper Manager)
Use eKuiper Manager to manage streams, test rules, and monitor topology graphs visually.
Start the container:
docker run -d \
  --name ekuiper-manager \
  -p 9082:9082 \
  -e DEFAULT_EKUIPER_ENDPOINT="http://localhost:9081" \
ankur-paan/ekuiper-manager:latest- Open
http://localhost:9082in your browser. - In the service management list, connect to
http://localhost:9081. - Use the visual rule editor to configure streams, write SQL queries, and monitor real-time throughput charts.
6. Next Steps
- Read the SQL Reference and Built-in Functions.
- Configure Persistent Connections.
- Read Production Deployment and Configuration.
- Connect to AI Agents through MCP.