Data Tracing with OpenTelemetry
rekuiper supports distributed data tracing using OpenTelemetry. You can trace event transformations and payload mutations across every pipeline operator.
OpenTelemetry Configuration
Configure the OpenTelemetry agent in etc/kuiper.yaml:
openTelemetry:
  serviceName: kuiperd-service
  enableRemoteCollector: false
  remoteEndpoint: localhost:4318
localTraceCapacity: 2048serviceName: The service name reported in tracing spans.enableRemoteCollector: Whentrue, exports spans to an OpenTelemetry Collector via OTLP/HTTP.remoteEndpoint: The destination address of the OpenTelemetry Collector.localTraceCapacity: The maximum number of traces retained in local ring buffer storage.
Enable Rule-Level Tracing
Enable tracing for a specific rule by setting enableRuleTracer: true in the rule options. Refer to Rule Configuration Options.
You can also toggle tracing dynamically using the Trace REST API.
Retrieve Trace Identifiers
Query recent Trace IDs for an active rule using the REST API:
GET http://localhost:9081/trace/rule/{ruleID}Refer to View Recent Trace IDs.
Inspect Tracing Data
Query detailed span hierarchies and operator timestamps:
GET http://localhost:9081/trace/{id}Refer to View Trace Span Details.
Integration with OpenTelemetry Collector and Jaeger
You can forward trace spans to Jaeger through an OpenTelemetry Collector.
1. Collector and Jaeger Configuration (docker-compose.yml)
Create a collector.yaml file:
receivers:
  otlp:
    protocols:
      http:
        endpoint: 0.0.0.0:4318

exporters:
  otlp:
    endpoint: jaeger:4317
    tls:
      insecure: true

processors:
  batch:

service:
  pipelines:
    traces:
      receivers: [otlp]
      processors: [batch]
      exporters: [otlp]
Create a docker-compose.yml file:
version: '3.8'

services:
  jaeger:
    image: jaegertracing/all-in-one:latest
    ports:
      - "16686:16686"  # Jaeger UI
      - "14250:14250"  # gRPC endpoint
      - "14268:14268"  # HTTP endpoint
    networks:
      - otel-net

  otel-collector:
    image: otel/opentelemetry-collector-contrib:latest
    command: ["--config=/etc/otel-collector-config.yaml"]
    volumes:
      - ./collector.yaml:/etc/otel-collector-config.yaml
    ports:
      - "4318:4318"  # OTLP HTTP receiver
    depends_on:
      - jaeger
    networks:
      - otel-net

networks:
  otel-net:
    driver: bridge
Start the containers:
docker-compose up -d2. Configure rekuiper to Export Spans
Update etc/kuiper.yaml:
openTelemetry:
  serviceName: kuiperd-service
  enableRemoteCollector: true
  remoteEndpoint: localhost:4318
  localTraceCapacity: 2048
3. Inspect Spans in Jaeger
Open http://localhost:16686 in your browser to inspect spans and call trees in the Jaeger UI.
Debugging Rules Using Data Tracing
You can trace individual payload records to identify operator drop points or filter logic.
1. Create a Filter Rule
{
    "id": "rule1",
    "sql": "select * from demo where a > 5",
    "actions": [
        {
            "log": {}
        }
    ]
}
2. Ingest Sample Records
Send two records: one meeting the filter criteria (a > 5) and one failing it:
{"a": 10}
{"a": 4}
3. Inspect Spans in Jaeger
Query the Trace ID list from the REST API and open the trace in Jaeger:
- For payload
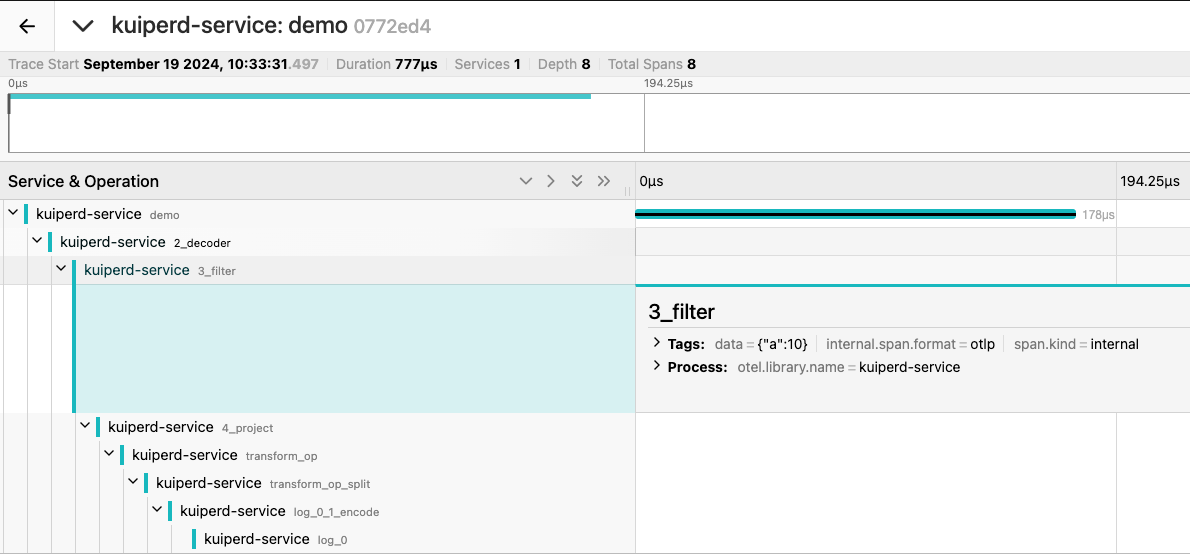
{"a": 10}, the trace spans traverse throughdecoder,project,transform_op, and the finalsink_logaction:
- For payload
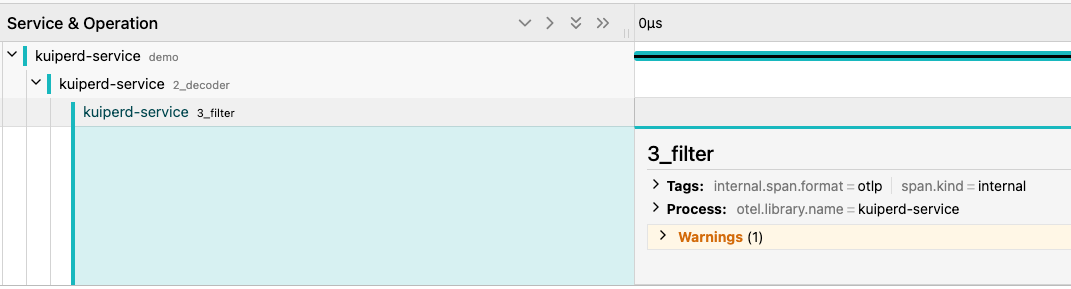
{"a": 4}, the trace spans terminate at the filter operator, confirming that the record was dropped as expected: