Monitor Rule Status with Prometheus
rekuiper integrates natively with Prometheus to export streaming metrics, operator latencies, and rule health states.
Prometheus Metrics
rekuiper exposes the following core metrics to Prometheus:
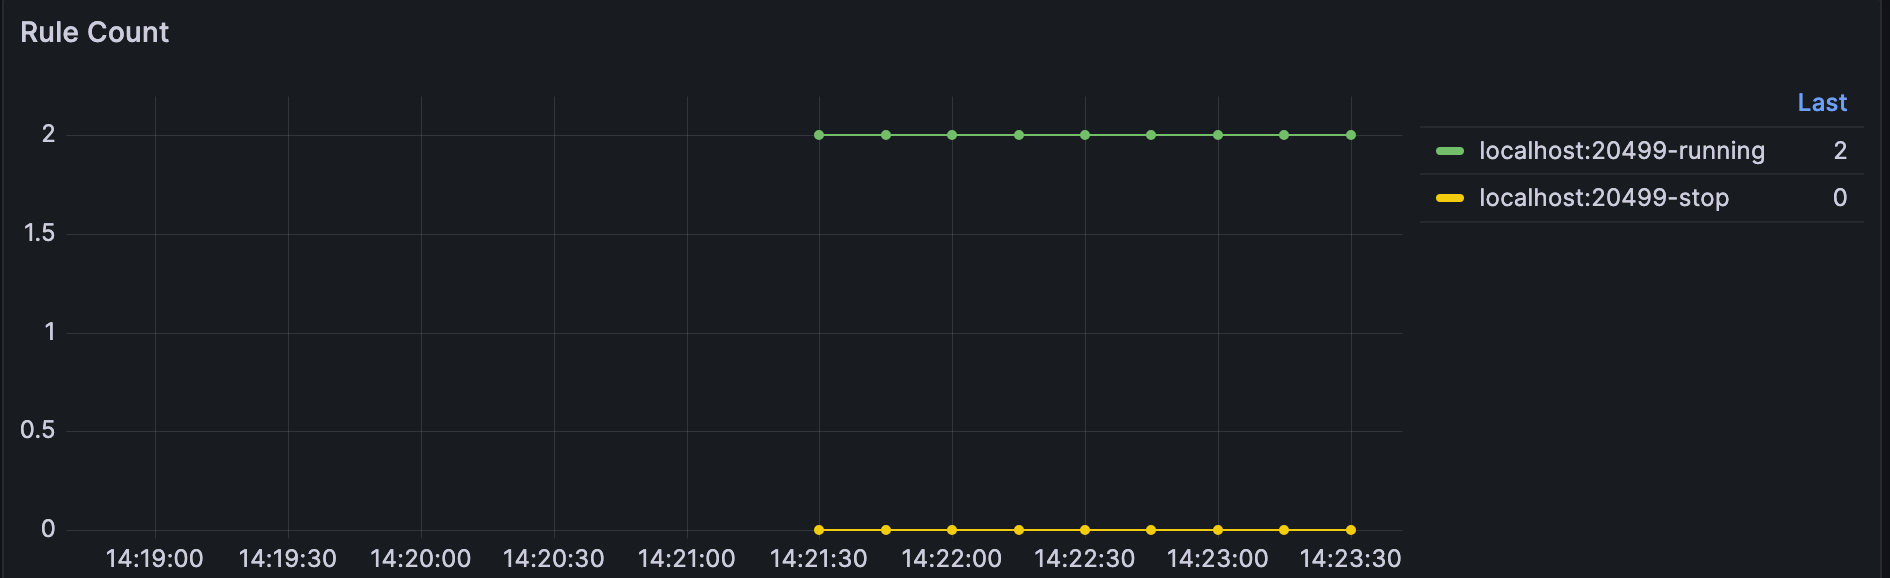
kuiper_rule_status: The operational state of each rule. Value1represents running,0represents paused or stopped, and-1represents abnormal exit.kuiper_rule_count: The total count of active and paused rules.kuiper_rule_cpu_ms: The CPU time used by the rule over the previous 30 seconds (in milliseconds).
Rule Status Metrics
You can inspect real-time metrics for a rule through the CLI, management console, or REST API:
GET http://127.0.0.1:9081/rules/rule1/statusResponse sample:
{
  "status": "running",
  "lastStartTimestamp": "1712126817659",
  "lastStopTimestamp": "0",
  "nextStopTimestamp": "0",
  "source_demo_0_records_in_total": 265,
  "source_demo_0_records_out_total": 265,
  "source_demo_0_process_latency_us": 0,
  "source_demo_0_buffer_length": 0,
  "source_demo_0_last_invocation": "2022-08-22T17:19:10.979128",
  "source_demo_0_exceptions_total": 0,
  "source_demo_0_last_exception": "",
  "source_demo_0_last_exception_time": 0,
  "op_2_project_0_records_in_total": 265,
  "op_2_project_0_records_out_total": 265,
  "op_2_project_0_process_latency_us": 0,
  "op_2_project_0_buffer_length": 0,
  "op_2_project_0_last_invocation": "2022-08-22T17:19:10.979128",
  "op_2_project_0_exceptions_total": 0,
  "op_2_project_0_last_exception": "",
  "op_2_project_0_last_exception_time": 0,
  "sink_mqtt_0_0_records_in_total": 265,
  "sink_mqtt_0_0_records_out_total": 265,
  "sink_mqtt_0_0_process_latency_us": 0,
  "sink_mqtt_0_0_buffer_length": 0,
  "sink_mqtt_0_0_last_invocation": "2022-08-22T17:19:10.979128",
  "sink_mqtt_0_0_exceptions_total": 0,
  "sink_mqtt_0_0_last_exception": "",
  "sink_mqtt_0_0_last_exception_time": 0
}
Operator Metric Definitions
Every pipeline operator (sources, operators, and sinks) exports the following counters and gauges:
records_in_total: Total input records received since rule initialization.records_out_total: Total output records emitted downstream after processing.process_latency_us: Execution latency of the most recent event batch in microseconds.buffer_length: Current message count waiting in the operator input buffer queue.last_invocation: Timestamp of the most recent operator execution.exceptions_total: Total recoverable errors encountered without stopping execution.last_exception: Diagnostic error message of the most recent exception.last_exception_time: Timestamp of the most recent exception.
Connection Metric Definitions
Sources and sinks export external connection lifecycle states:
connection_status: Current connection state (1= connected,0= connecting,-1= disconnected).connection_last_connected_time: Unix timestamp of the last successful connection.connection_last_disconnected_time: Unix timestamp of the last disconnection event.connection_last_disconnected_message: Error message recorded during the last disconnection.connection_last_try_time: Unix timestamp of the last reconnection attempt.
Configure the Prometheus Exporter in rekuiper
Enable the Prometheus endpoint in etc/kuiper.yaml:
basic:
  prometheus: true
  prometheusPort: 20499
When running in Docker, enable metrics using environment variables:
docker run -d \
  --name ekuiper \
  -p 9081:9081 \
  -p 20499:20499 \
  -e KUIPER__BASIC__PROMETHEUS=true \
  ankurkrp/rekuiper:0.506-beta
The server exposes raw Prometheus metrics on http://localhost:20499/metrics.
Scrape Metrics Using Prometheus
Download and install Prometheus from the Prometheus Download Page.
Add rekuiper to scrape_configs in prometheus.yml:
global:
  scrape_interval: 15s
  evaluation_interval: 15s

scrape_configs:
  - job_name: 'ekuiper'
    static_configs:
      - targets: ['localhost:20499']
Start the Prometheus service:
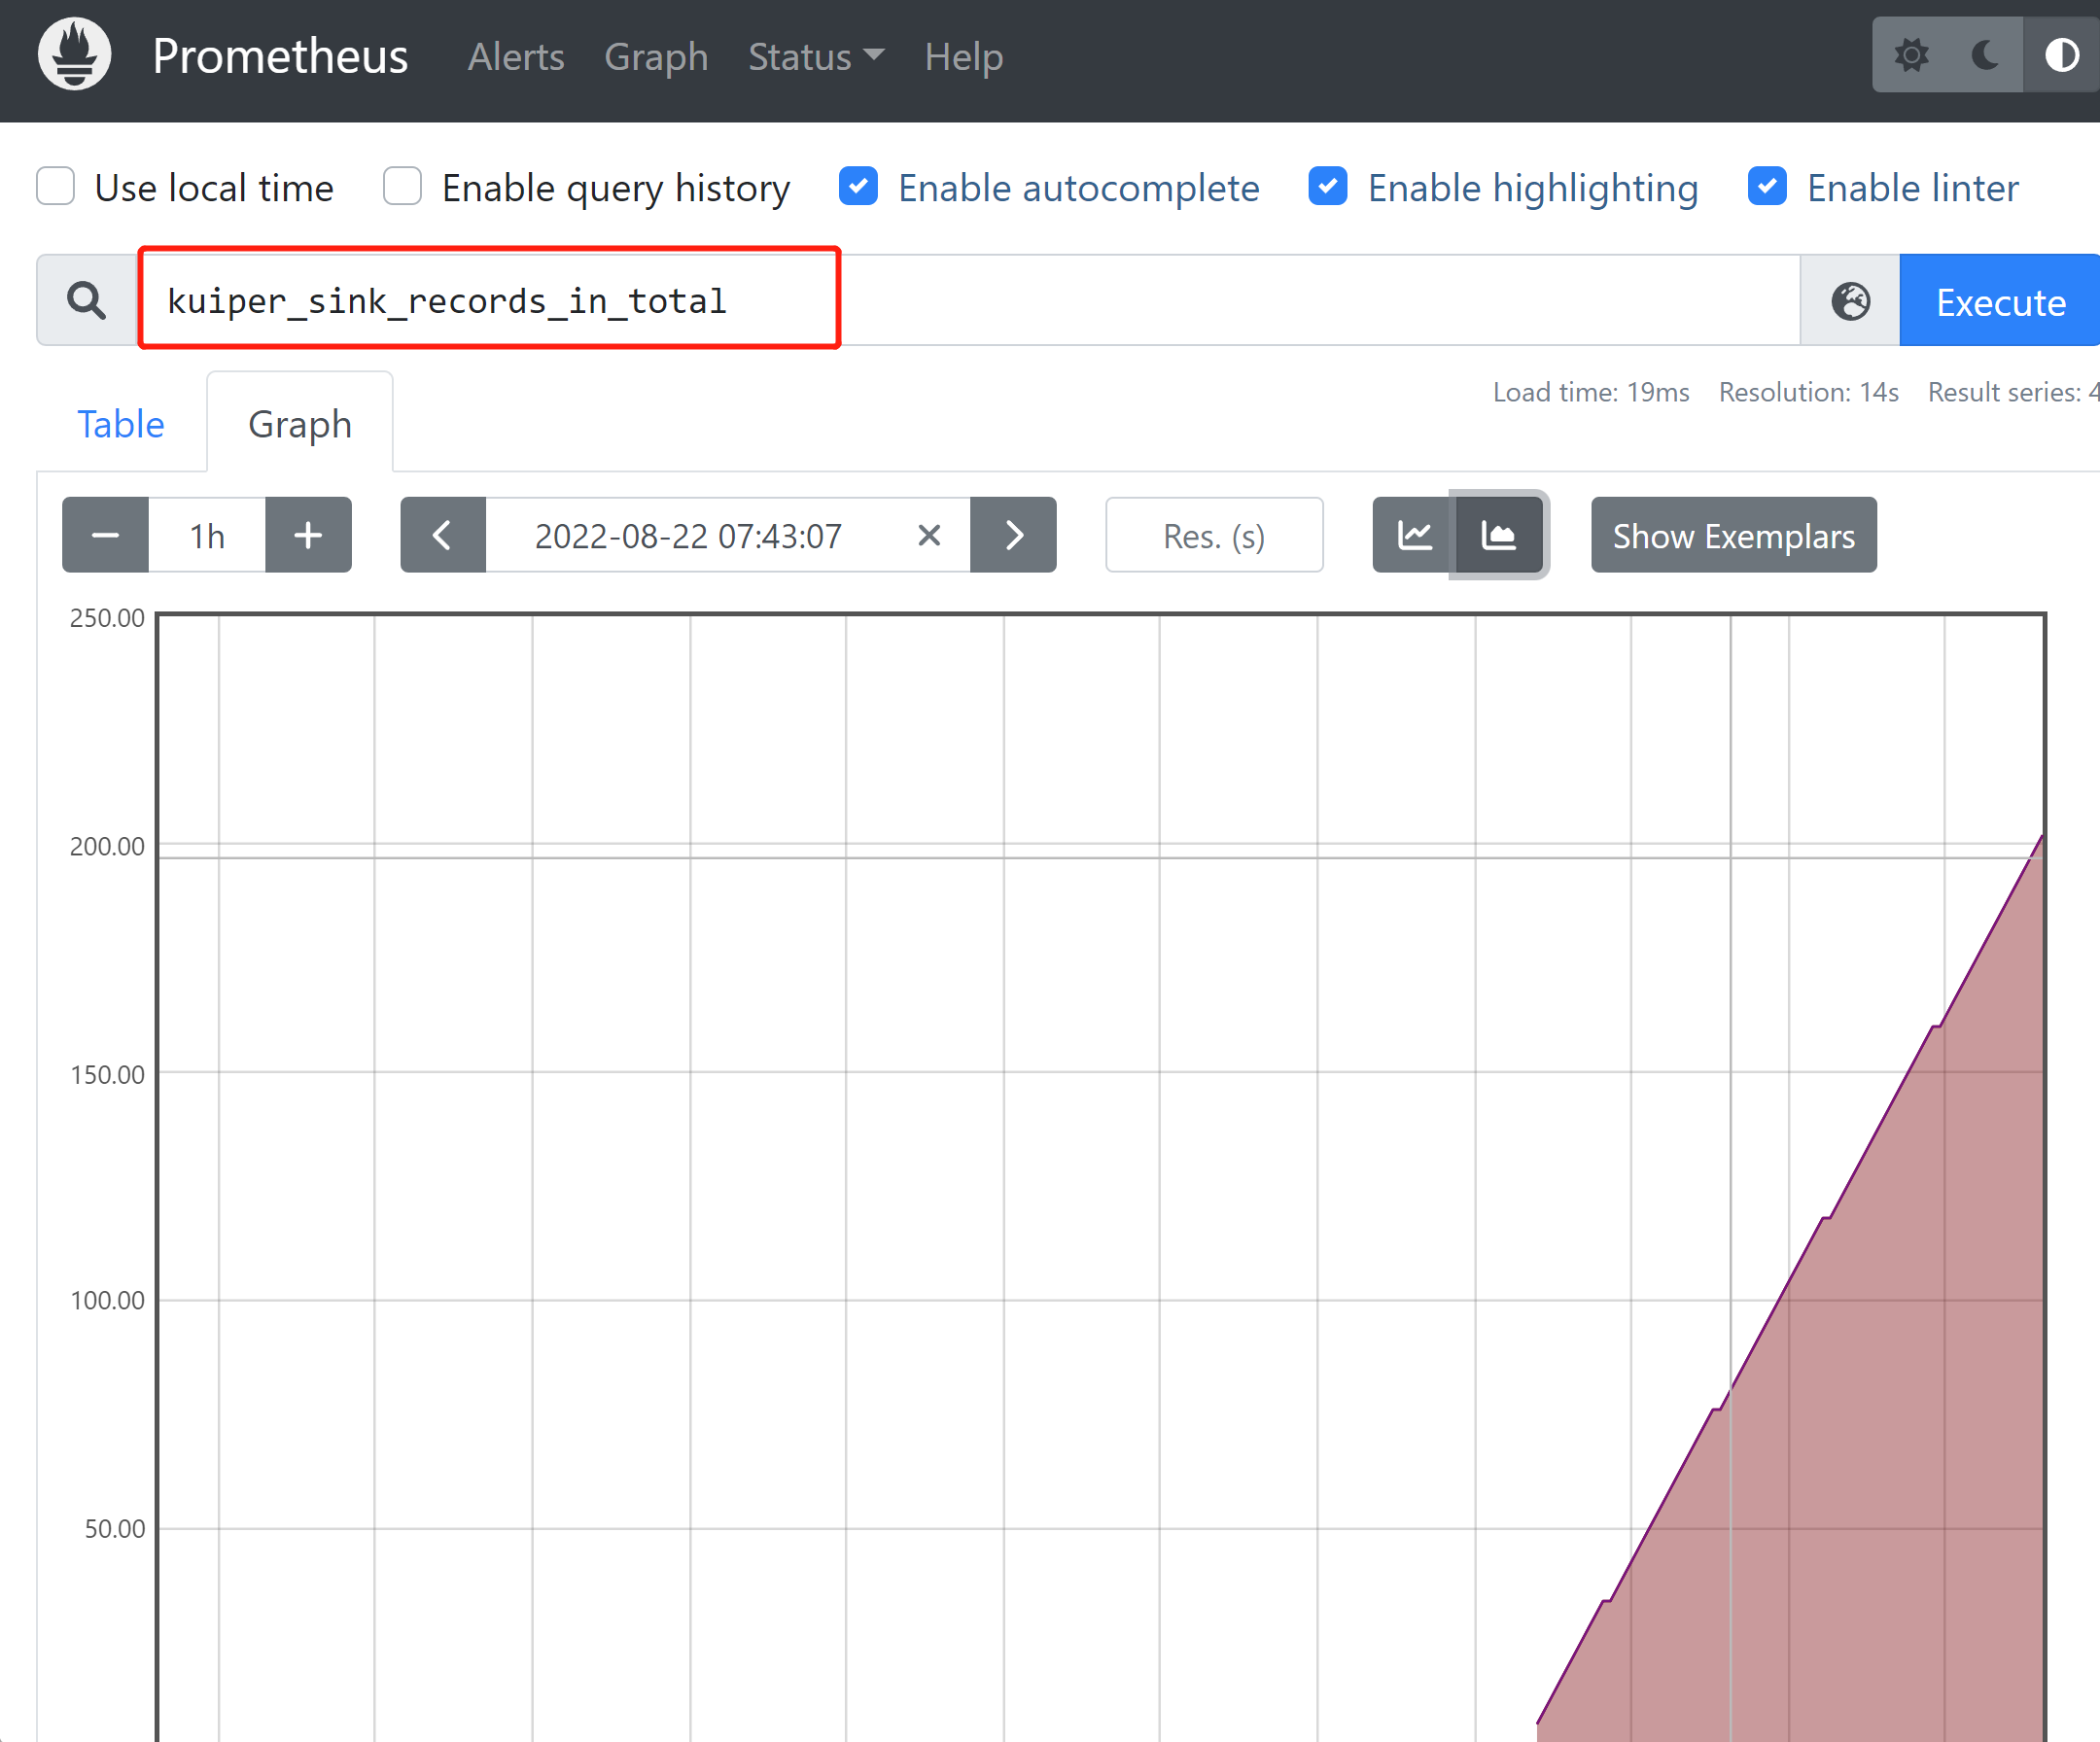
./prometheus --config.file=prometheus.ymlOpen http://localhost:9090 to query metrics and generate line graphs:
Visualize Metrics with Grafana
rekuiper provides preconfigured Grafana dashboard templates.
- Verify that Grafana has Prometheus configured as an active data source.
- Download the dashboard schema from the Metrics Dashboard Template.
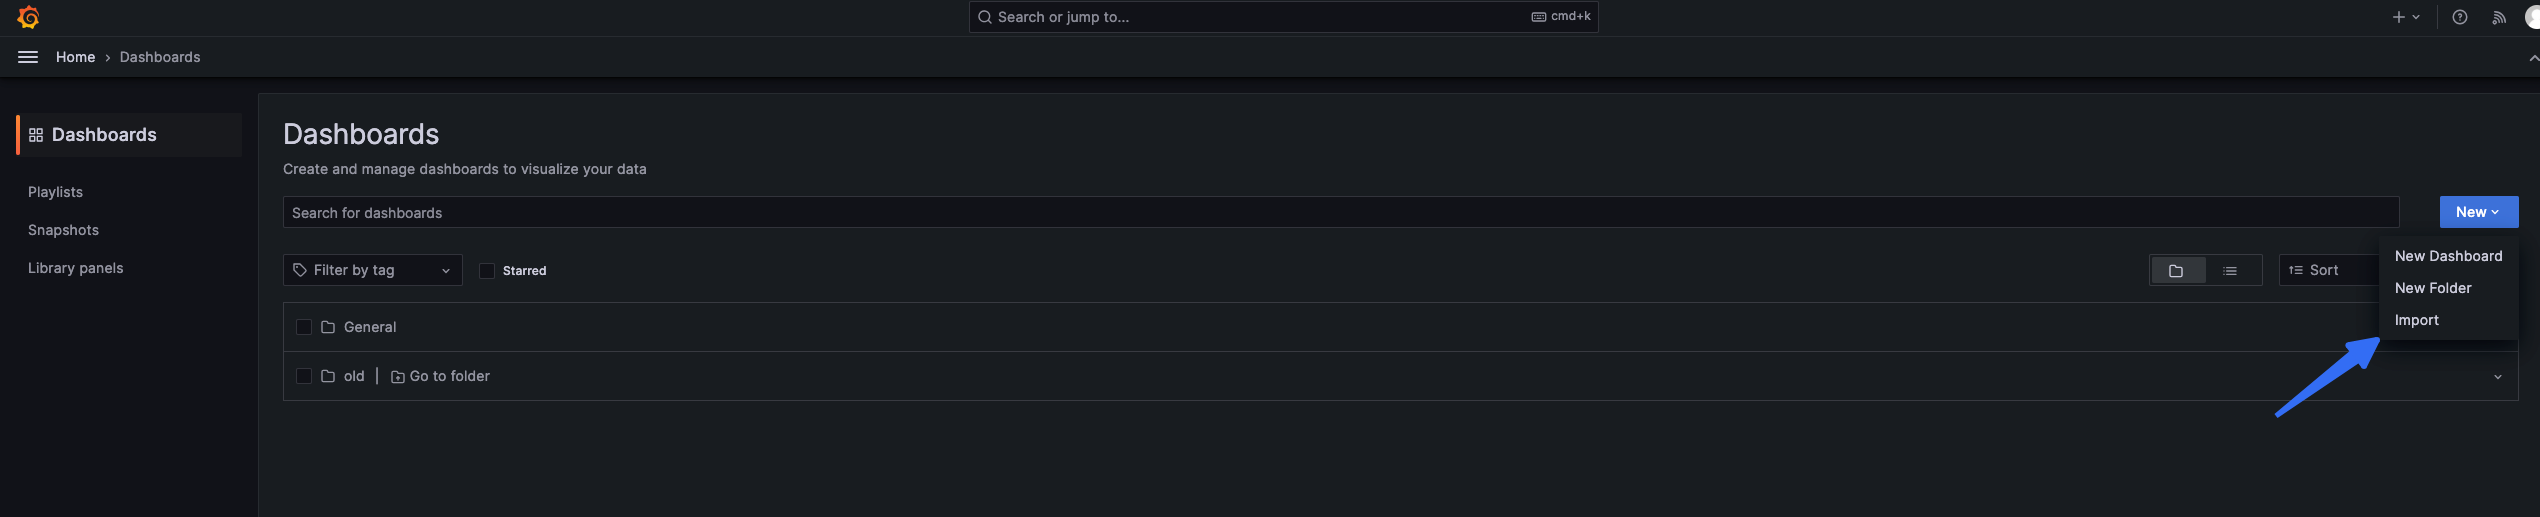
- In Grafana, select Dashboards > Import.
- Paste the JSON template and click Load.
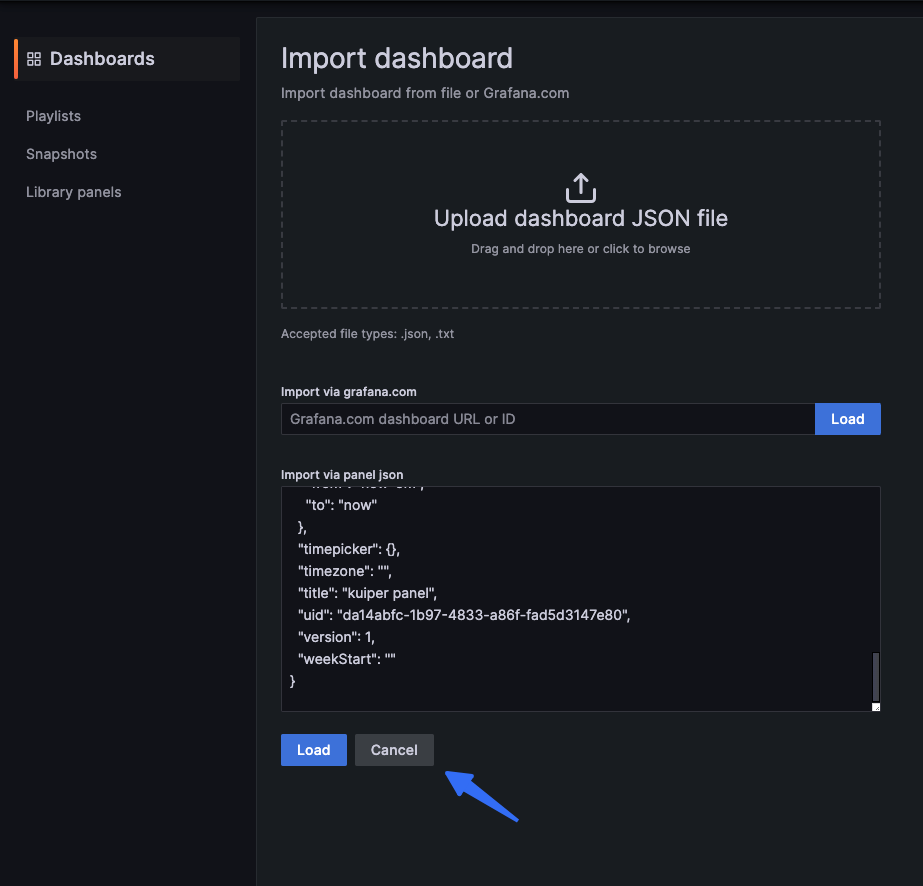
- Select the Prometheus data source and click Import.
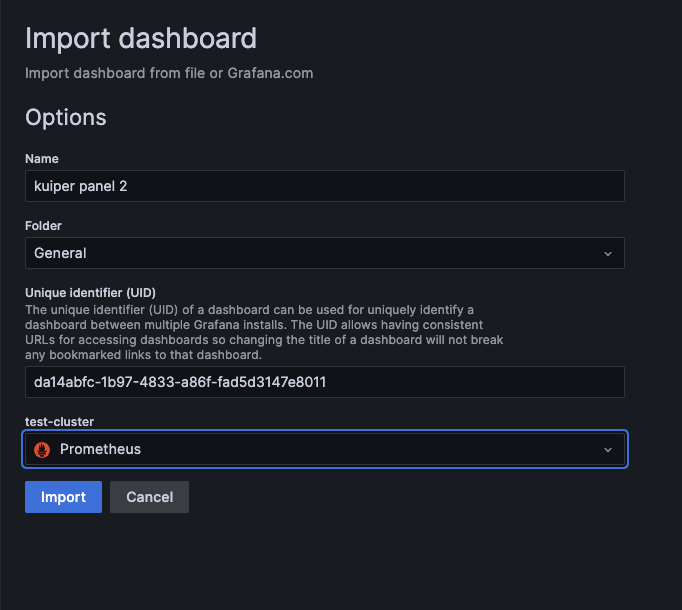
The dashboard displays instances and rule metrics:
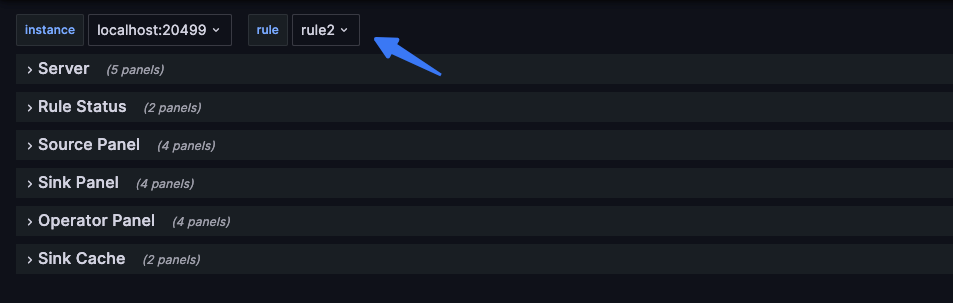
Inspect rule health states over time using kuiper_rule_status:
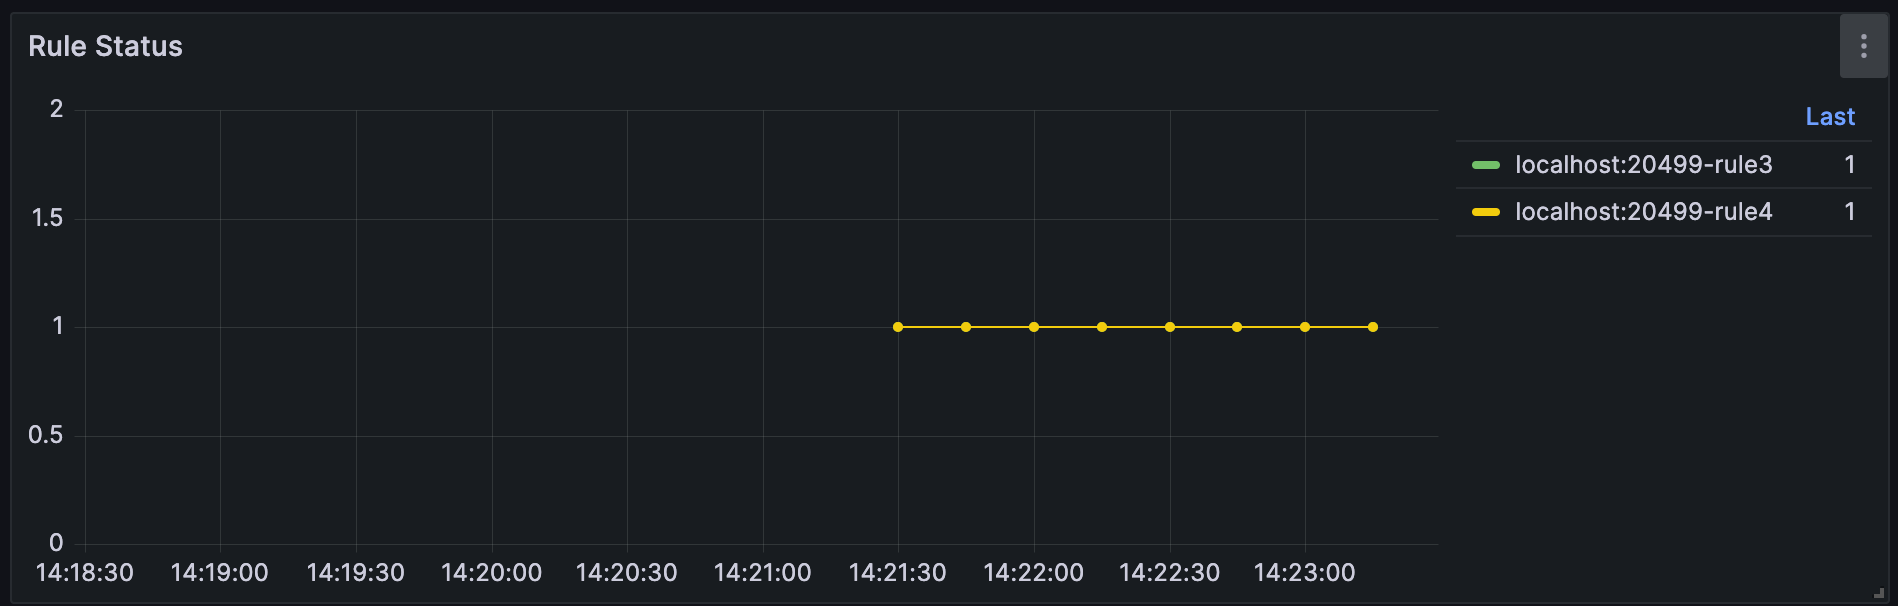
Inspect aggregate running and paused rule counts using kuiper_rule_count: