Management Web UI
The web management console provides a browser-based user interface to monitor and configure rekuiper instances, streams, rules, and plugins. This guide explains how to install the console, connect to a rekuiper instance, and create an end-to-end streaming rule.
Architecture
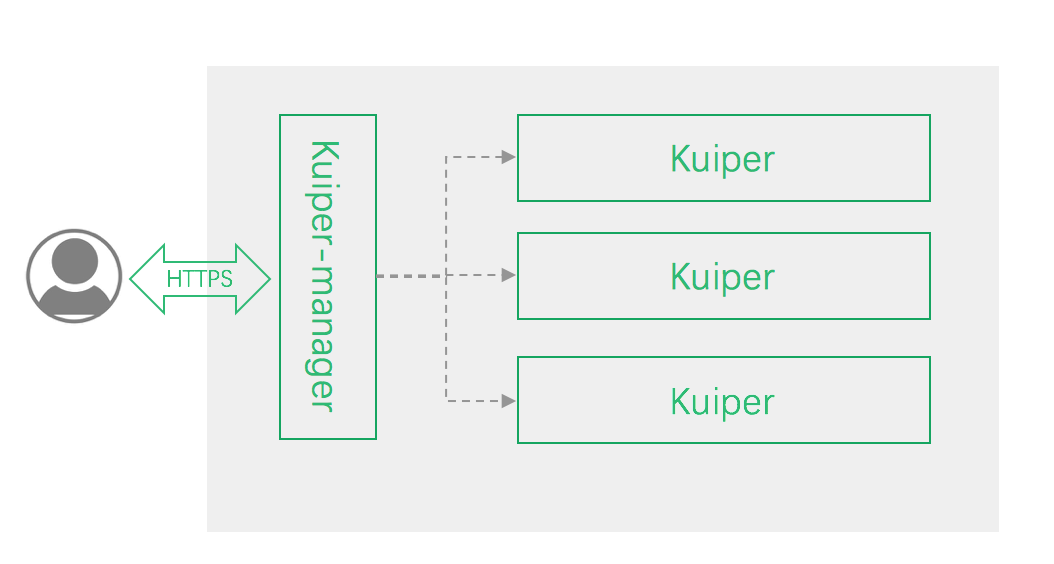
The visual management architecture comprises three layers:
- Web Browser UI: Displays interactive dashboards for stream creation, rule execution graphs, and throughput metrics.
- kuiper-manager: A lightweight reverse proxy service providing authentication and node management.
- rekuiper Daemon: The core stream processing engine exposing REST APIs on port
9081.
Installation
1. Start rekuiper in Docker
Start the rekuiper engine exposing ports 9081 (REST API), 20498 (NanoIPC), and 20499 (Prometheus metrics):
docker run -d \
  --name rekuiper \
  -p 9081:9081 \
  -p 20498:20498 \
  -p 20499:20499 \
  ankurkrp/rekuiper:0.506-beta
Verify engine reachability:
curl http://localhost:9081/ping2. Start the Management Console
Run the management console container on port 9082:
docker run -d \
  --name ekuiper-manager \
  -p 9082:9082 \
  -e DEFAULT_EKUIPER_ENDPOINT="http://localhost:9081" \
  ankur-paan/ekuiper-manager:latest
Getting Started
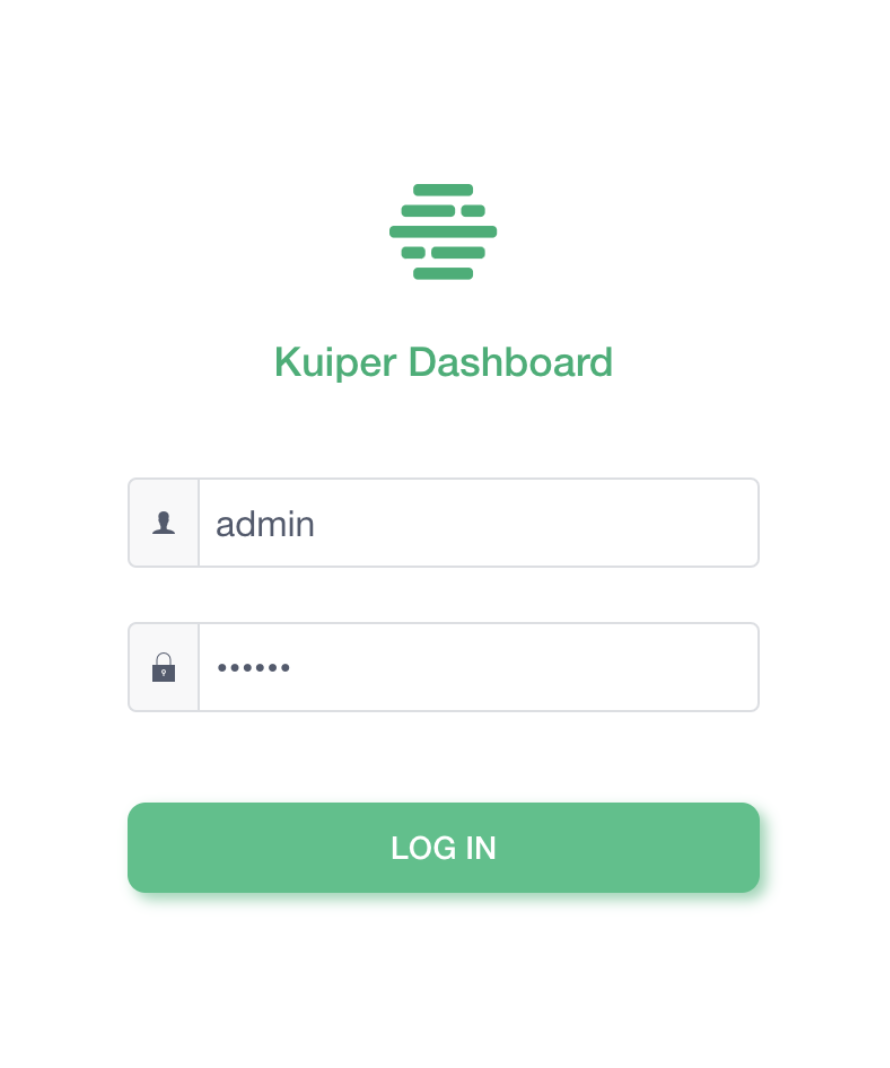
1. Log In to the Console
Navigate to http://localhost:9082 in your browser. Enter the default credentials:
- Username:
admin - Password:
public
2. Register a rekuiper Service
Configure a node connection:
- Service Type: Select
Direct Connect service. - Service Name: Enter an identifier (for example:
example). - Endpoint URL: Enter
http://localhost:9081or container IPhttp://<IP>:9081.
Inspect container IP:
docker inspect rekuiper | grep IPAddress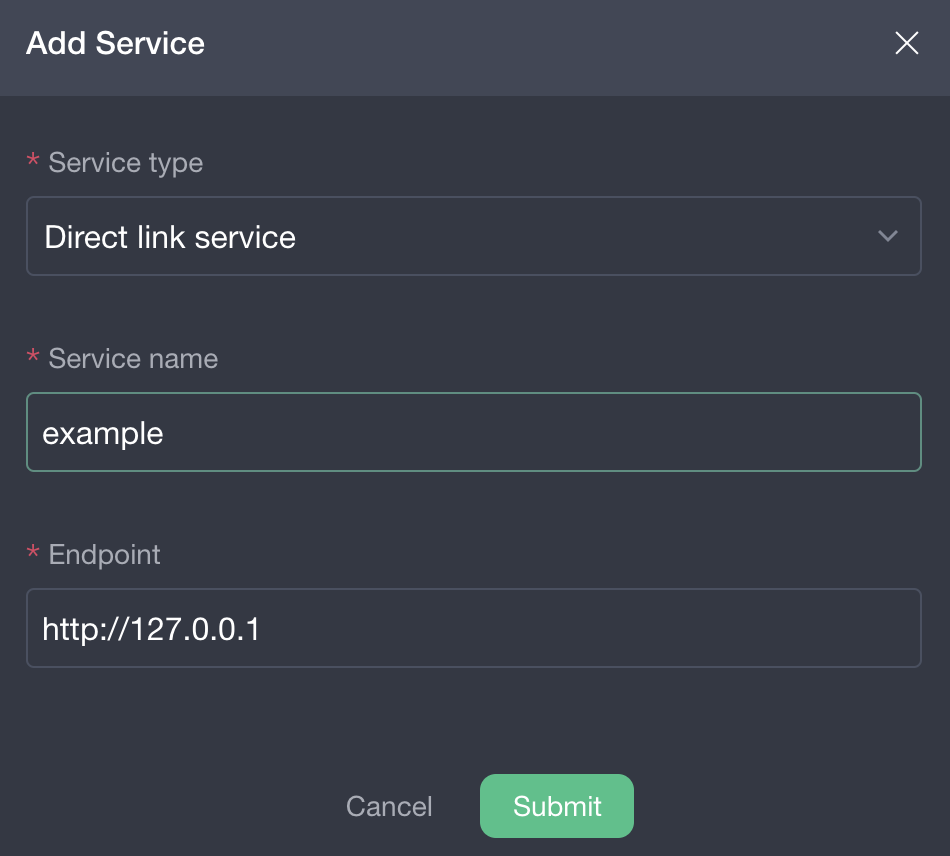
3. Create a Stream
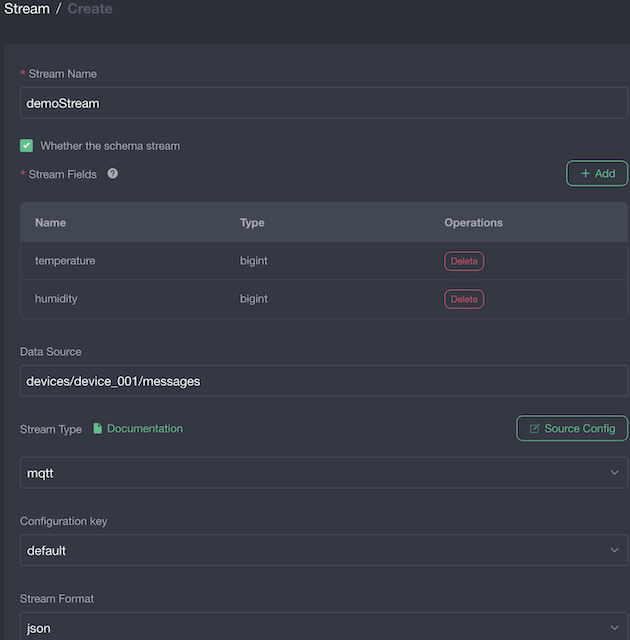
Create a stream named demoStream:
- Data Source: MQTT broker at
tcp://127.0.0.1:1883. - Topic:
devices/device_001/messages. - Schema Fields:
temperature:biginthumidity:bigint
4. Create a Rule
Define a rule named demoRule with SQL filtering:
SELECT * FROM demoStream WHERE temperature > 30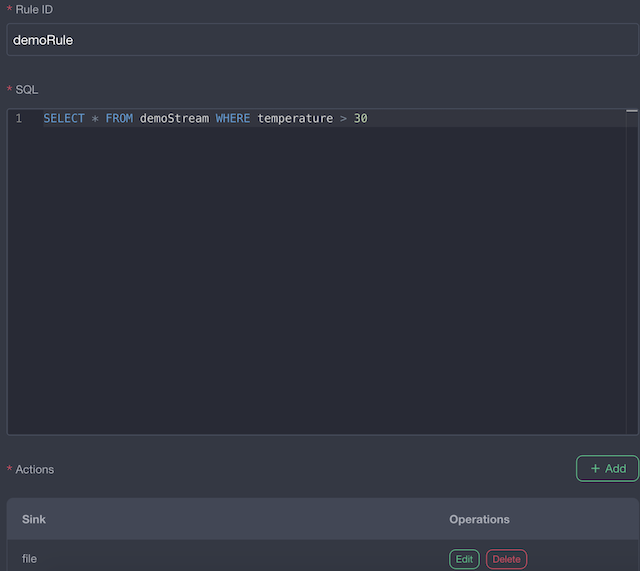
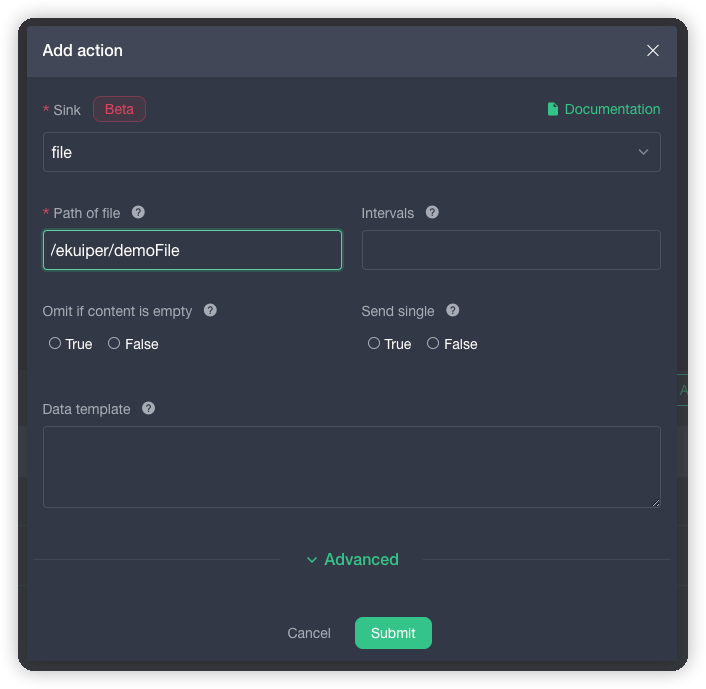
Add an action destination to write filtered events to /tmp/demoFile. Refer to the File Sink Guide.
5. Ingest Telemetry and Inspect Metrics
Publish test telemetry records using mosquitto_pub:
mosquitto_pub -h 127.0.0.1 -m '{"temperature": 40, "humidity": 20}' -t devices/device_001/messagesOpen the rule dashboard to monitor real-time throughput metrics, pause or restart execution, and inspect logs:
